Dashboard
The dashboard shows several statistics on different modules such as
• The Sales Module
• The Product Module
• The Product Categories
You can thus measure the evolution of sales in perspective.
First section
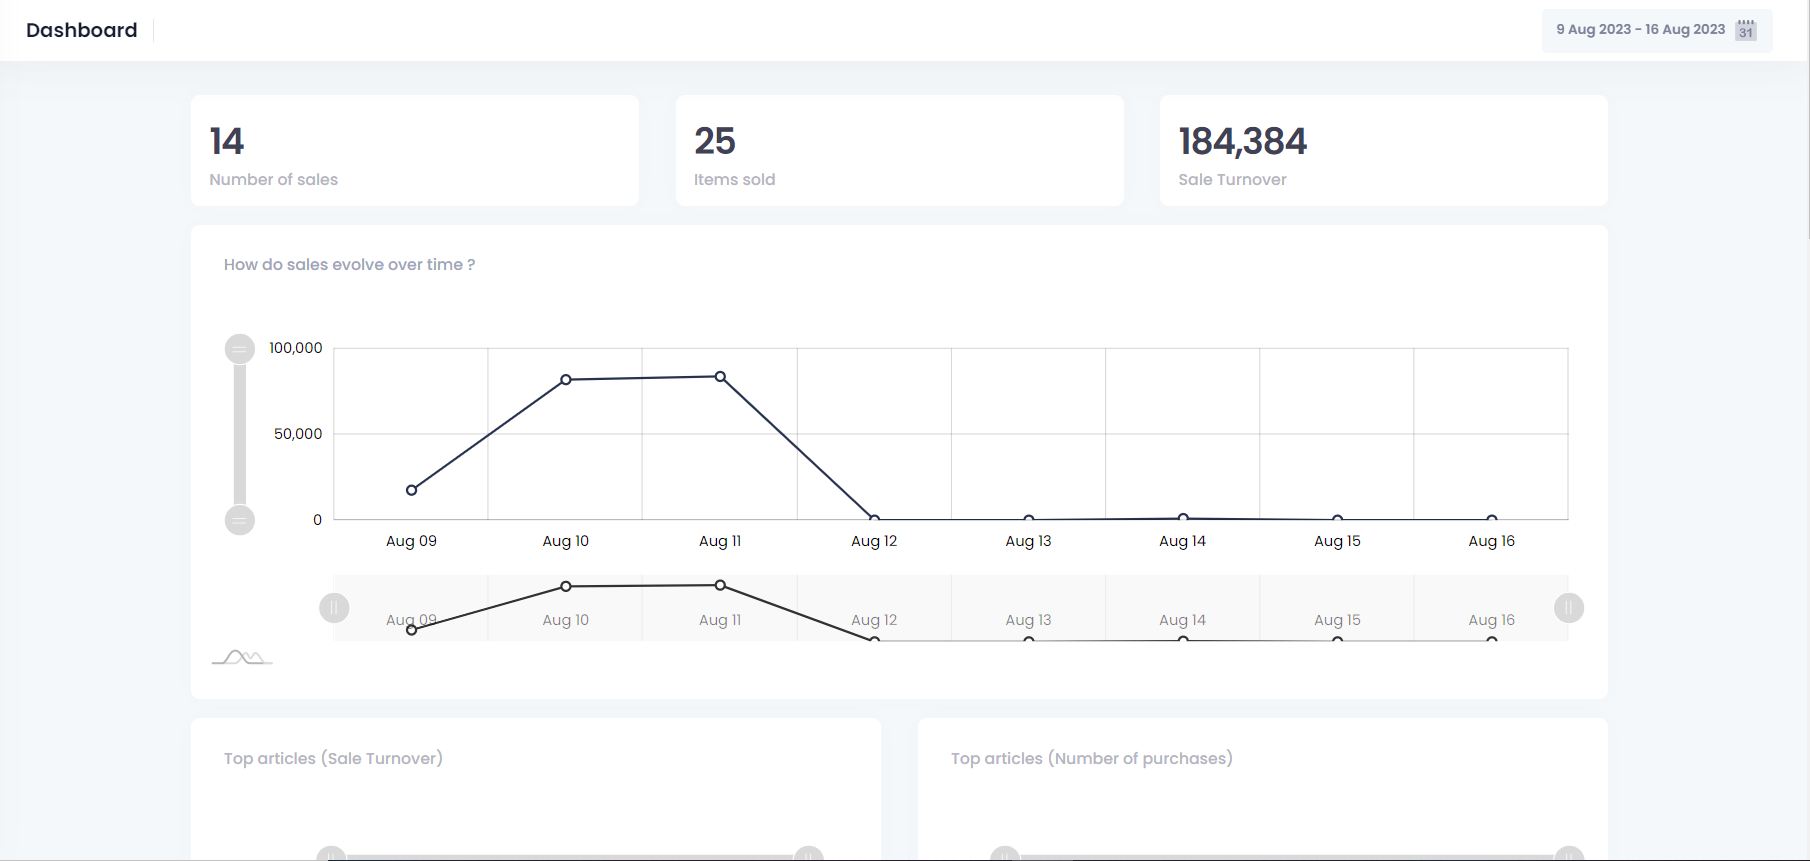
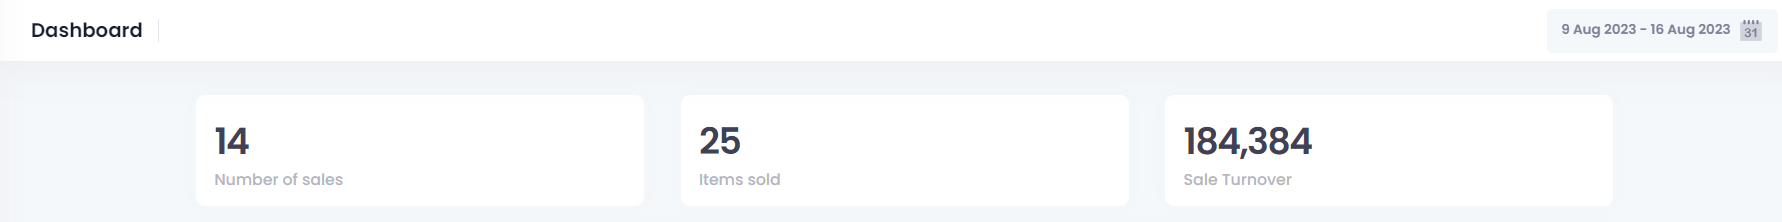
The first section presents statistical data defined as follows:
• Total Number of sales
• Total Number of items sold
• Total turnover
Following sections
The following sections respectively present statistics informing the user about:
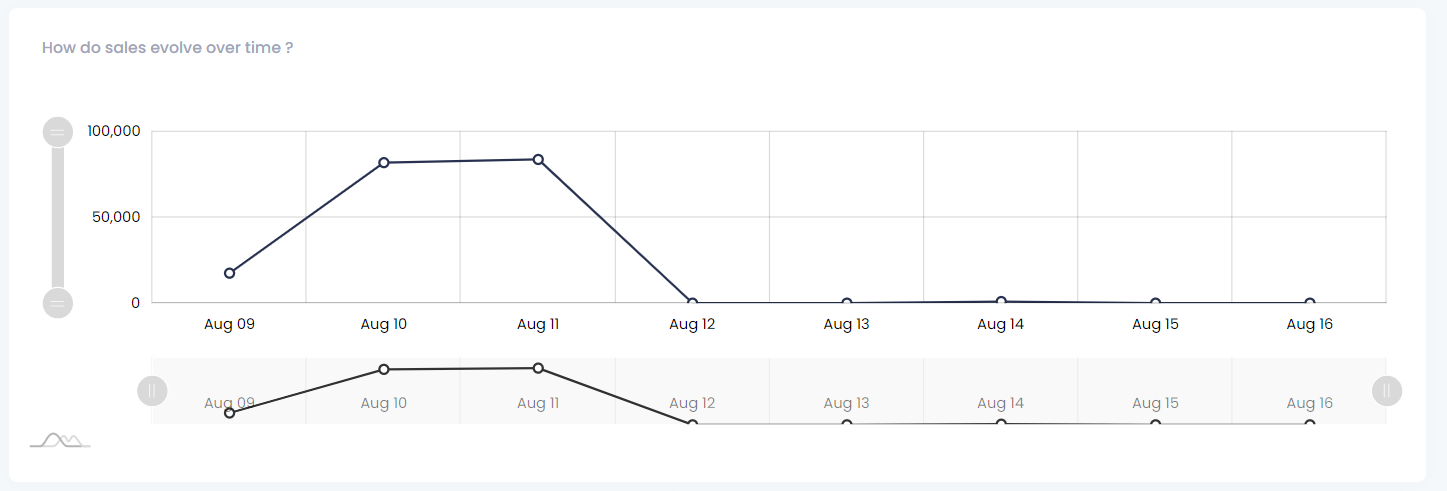
- How are sales changing over time?
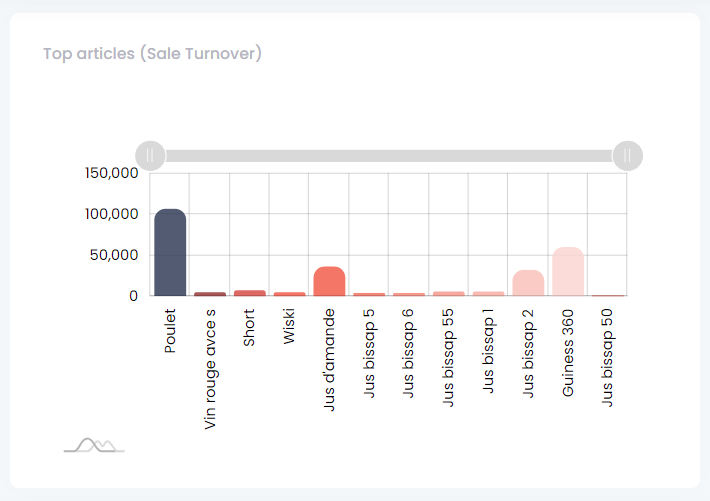
- What are the most profitable items?
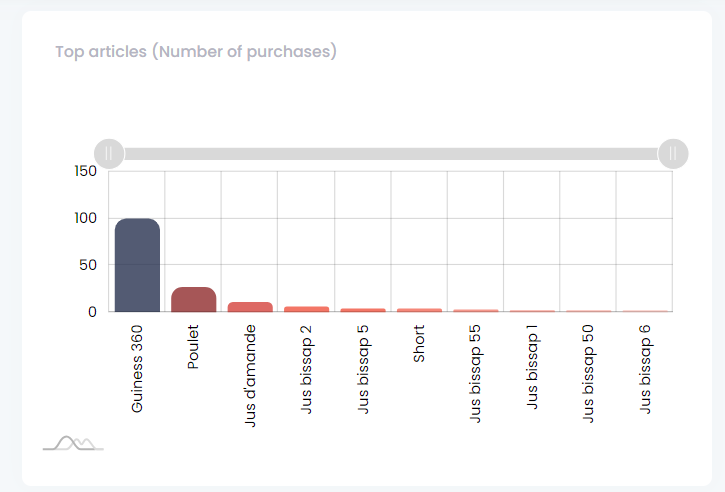
- What items are most frequently purchased?
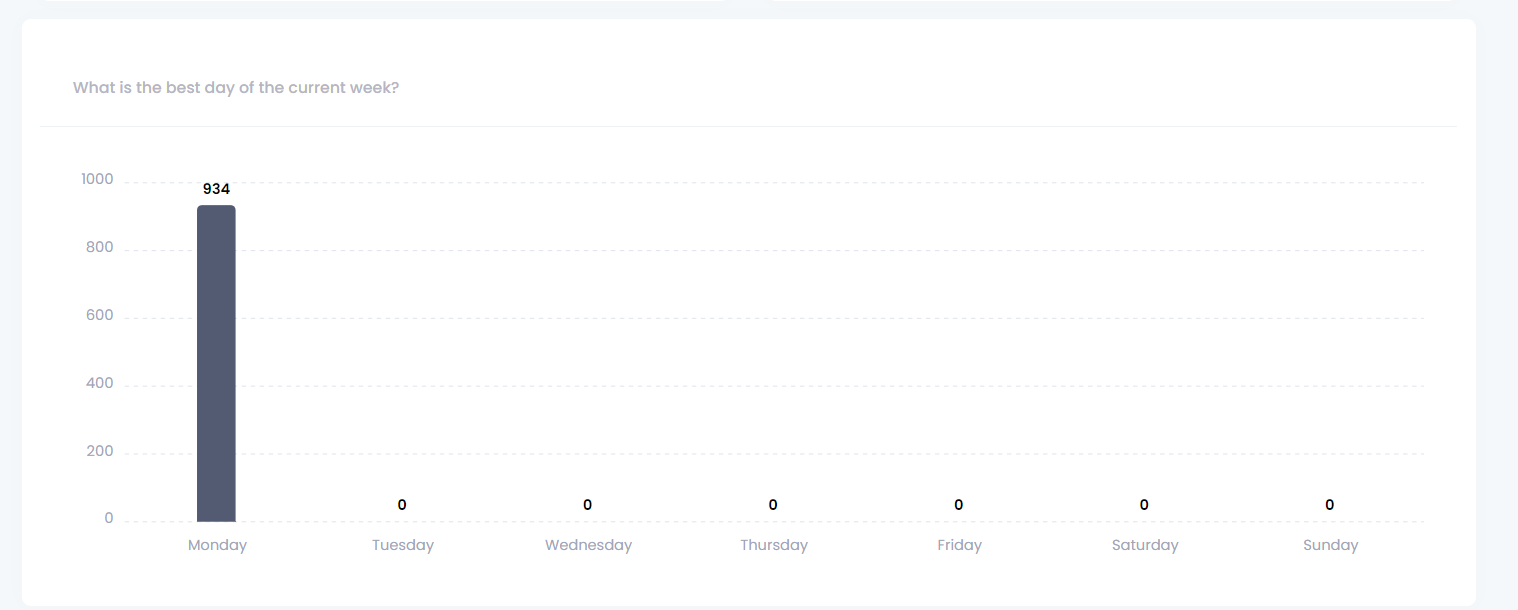
- Overview of the best day of the current week
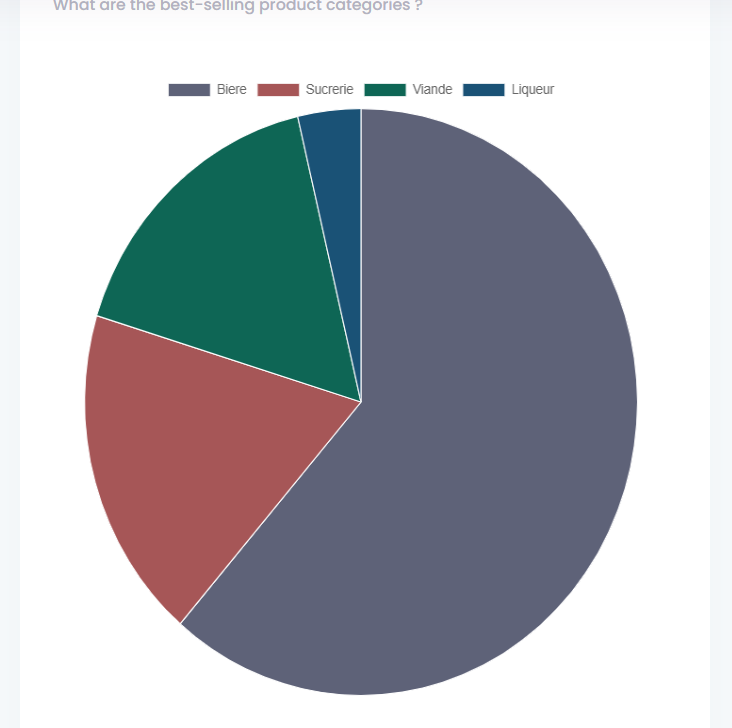
- Overviews of the best-selling product
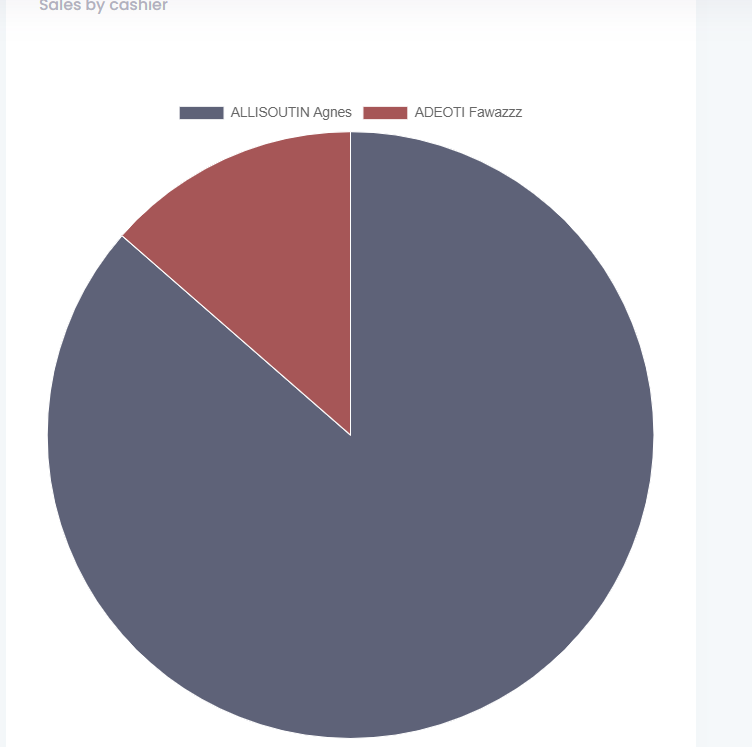
- Overviews of sales by cashier
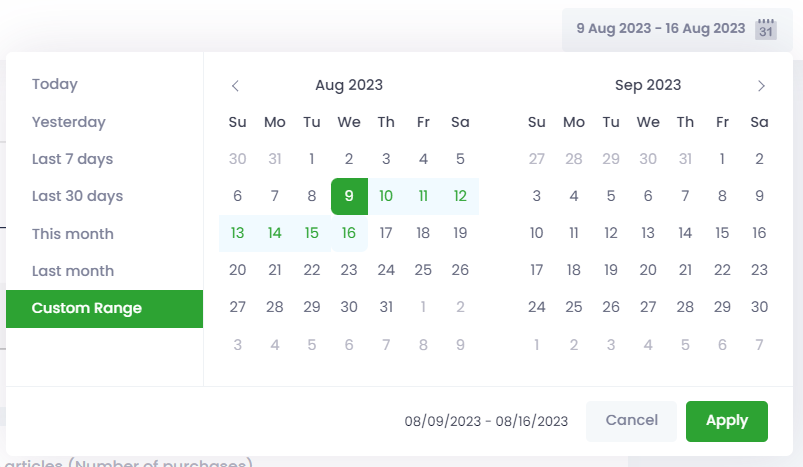
These different statistics vary according to the period selected.
To change the period, click the button highlighted on the capture below